


Most teams do not realize they have a cloud cost problem until the bill becomes difficult to justify. By that point, spending is already spread across services, teams, and environments.
Recent research confirms the scale of the issue. Large-scale FinOps data shows organizations managing tens of billions in cloud spend still struggle with cost efficiency. At the same time, many organizations have not reached advanced FinOps maturity levels.
Most teams already use dashboards, alerts, and cost monitoring tools. The challenge comes from how teams prioritize actions. Effort is often spread across too many initiatives, which reduces measurable impact.
But here’s the trick: the 80/20 rule can deliver most of the cost reduction. In cloud environments, five areas consistently account for most savings. Focusing on these areas first leads to faster results and clearer outcomes.
In this article, we explain those five areas and show how to approach them with practical, engineering-focused steps.
Why cloud costs keep increasing
Cloud cost growth is not random. It follows a small set of recurring patterns that appear across organizations, regardless of size or industry. As systems scale, these patterns become more pronounced and harder to manage.
Three drivers consistently contribute to this growth.
1. Architectural complexity expands the cost surface area
Modern cloud systems are built from multiple layers of services. Containers, serverless functions, managed databases, event pipelines, and third-party integrations all introduce separate pricing models. Each component may appear efficient on its own, but together they create a fragmented and difficult-to-track cost structure.
FinOps data shows that organizations are now managing a broader scope of spend, including cloud, SaaS, and shared platforms. This expansion increases the number of cost variables teams must monitor.
As complexity increases, cost attribution becomes harder. Teams struggle to map costs to services or owners, which slows down optimization. Without clear ownership, inefficiencies persist and accumulate over time.
2. AI and data workloads drive high and unpredictable demand
AI and data-intensive workloads are now a major driver of cloud cost growth. Training models requires sustained compute usage, often on specialized infrastructure. Inference workloads scale dynamically, which introduces variability in demand and cost.
At the same time, infrastructure demand is increasing due to AI adoption, which contributes to higher baseline costs across cloud environments. Recent data shows:
- Hyperscalers are increasing infrastructure capacity specifically for AI workloads, shifting from experimentation to production deployment.
- Cloud infrastructure spending is expected to grow by another ~27% in 2026, with AI as a primary driver.
- AI demand is expanding beyond GPUs into CPU, storage, and networking, increasing overall baseline infrastructure costs.
In addition to computing, data itself drives cost. Storage volumes grow continuously, and moving data between services or regions introduces additional charges. These costs are often underestimated during system design and only become visible at scale.
3. Persistent inefficiencies and limited cost visibility
Last but not least, a significant portion of cloud cost growth comes from operational inefficiencies that remain unaddressed. These include overprovisioned compute resources, idle infrastructure, and uncontrolled storage growth.
Limited cost visibility makes the problem worse. When teams cannot clearly allocate costs to services or owners, optimization becomes reactive. Decisions are made after costs are incurred, rather than being built into system design.
As organizations adopt multi-cloud and SaaS environments, visibility becomes even more fragmented. Without a unified view, teams lose the ability to compare workloads and identify inefficiencies effectively.
Together, these three factors create a system where costs grow faster than expected unless actively controlled. So, how to combat them?
The 80/20 rule applied to cloud cost optimization
Do you remember learning about the 80/20 rule at school and wondering when you would ever use it?
The idea is simple. A small portion of inputs drives most of the outcomes. In cloud environments, this pattern shows up more often than expected.
In cloud cost optimization, a small number of decisions and inefficiencies account for the majority of spend. The rest contributes, but not at the same scale. In cloud cost optimization, this principle holds true across different architectures and industries.
The FinOps Foundation identifies workload optimization and waste reduction as top priorities for practitioners. Instead of attempting to optimize every component, teams can focus on the most impactful areas first. This approach improves efficiency and accelerates results. It also aligns well with engineering workflows, where prioritization drives progress.
In practice, five categories consistently deliver the majority of cost savings – let’s explore each one in more detail.
The five fixes that drive most cloud cost savings
Rightsize compute resources
Compute often represents the largest portion of cloud spend. Many workloads run on instances sized for peak demand rather than actual usage patterns. This leads to consistent overprovisioning.
Rightsizing involves aligning compute resources with observed utilization. Teams can analyze CPU, memory, and network usage over time to determine appropriate instance sizes. This process often reveals that workloads use only a fraction of allocated capacity.
Common actions include:
- Reducing instance sizes based on actual usage patterns
- Selecting more efficient instance families for better price-performance
- Tuning autoscaling policies to better match real demand
- Adjusting scaling thresholds to avoid excess capacity during normal operation
Thus, teams can reduce compute costs within days by adjusting configurations based on real usage data.
Eliminate idle and unused resources
Idle resources represent direct waste. These include stopped virtual machines, unattached storage volumes, unused load balancers, and outdated snapshots. These resources often persist due to rapid development cycles and limited cleanup processes.
Engineering teams can address this issue through regular audits and automation. Scheduled shutdown of non-production environments reduces costs during off-hours. Automated scripts can identify and remove orphaned resources.
A practical approach involves setting policies for resource lifecycle management. For example, development environments can be automatically stopped outside working hours. Snapshots older than a defined threshold can be deleted unless explicitly retained.
These actions require minimal effort but produce consistent savings. Many organizations recover a significant portion of wasted spend through cleanup alone.
Optimize storage usage
Storage costs increase gradually and often escape attention. Data accumulates across logs, backups, analytics pipelines, and application data. Over time, storage becomes a substantial portion of total cloud spend.
Effective storage optimization focuses on data lifecycle management. Not all data requires high-performance storage. Frequently accessed data can remain in premium tiers, while infrequently accessed data can move to lower-cost tiers.
Lifecycle policies automate this process. Data can transition from hot storage to cold storage and eventually to archival tiers. This reduces costs without affecting application performance.
Backup and snapshot management also play a critical role. Redundant backups and outdated snapshots increase storage usage without providing additional value. Teams should define retention policies based on recovery requirements.
Cloud provider billing documentation outlines how storage and data usage directly impact costs over time. Without clear policies, data growth continues unchecked.
Use commitment-based pricing models
Cloud providers offer pricing models that reward predictable usage. These include reserved instances, savings plans, and spot instances. These models reduce costs in exchange for usage commitments or flexibility.
AWS shows how savings plans provide lower pricing for committed compute usage, since reserved instances work well for stable workloads with predictable demand. Savings plans provide more flexibility across instance types and services. Spot instances offer lower pricing but introduce the risk of interruption.
Engineering teams need to balance cost savings with operational requirements. Overcommitting leads to unused capacity, which creates new inefficiencies. Undercommitting limits potential savings.
Accurate usage forecasting improves decision-making. Teams can analyze historical usage patterns to determine appropriate commitment levels. This approach reduces risk and maximizes cost efficiency.
Build strong cost visibility
Cost visibility forms the foundation of all optimization efforts. Without clear insights into spending, teams cannot identify inefficiencies or track improvements.
Effective visibility requires consistent tagging of resources. Tags enable cost allocation by team, service, or environment. This allows organizations to assign ownership and accountability.
Real-time monitoring further improves visibility. Teams can detect anomalies, track trends, and respond to unexpected changes quickly. Dashboards should provide clear breakdowns of costs across dimensions such as service, region, and workload.
Visibility also supports collaboration between engineering and finance teams. Shared data enables better planning and alignment.
AWS vs Azure vs GCP: where costs differ
Cloud providers offer similar capabilities, but pricing models and strengths vary. Understanding these differences helps teams make informed decisions.
We’ve highlighted key cost-related differences across the three major providers.
Cost efficiency depends on workload alignment. A well-optimized workload can run efficiently on any major provider. Poor configuration leads to unnecessary costs regardless of the platform.
Teams should evaluate workloads based on performance requirements, data patterns, and operational constraints. Provider selection alone does not determine cost outcomes.
Hidden costs and emerging risks
Some cost drivers are difficult to identify during system design and often appear only at scale. These costs tend to surface as unexpected spikes in spending, which makes them harder to control without structured monitoring and ownership.
Below are the most common hidden cost drivers, along with practical guidance from the TYMIQ data engineering team.
1. Data transfer and egress costs
Data transfer charges remain one of the most underestimated cost factors in cloud architectures. Moving data across regions, between services, or outside the cloud introduces additional fees that scale directly with usage. In distributed systems, these costs grow quickly and are often not visible until workloads reach production scale.
2. AI and machine learning workload variability
AI workloads introduce unpredictable cost patterns. Training jobs can run for extended periods and consume large amounts of compute resources, especially with GPU-based infrastructure. Inference workloads scale dynamically with demand, which creates irregular and difficult-to-forecast usage.
According to recent research, 80% of enterprises miss their AI infrastructure cost forecasts by more than 25%, and 84% report margin impact from AI workloads.
Expert note from TYMIQ data engineering team: AI workloads require strict guardrails from the start. Experimental jobs can run longer than expected and consume large budgets in a short time. Setting usage quotas, enforcing runtime limits, and enabling automatic shutdown policies helps prevent uncontrolled spending.
3. Kubernetes inefficiencies
Kubernetes environments often operate with excess capacity due to conservative provisioning strategies. Clusters are configured to avoid performance issues, but this results in persistent overprovisioning. Inefficient pod scheduling and inflated resource requests further increase waste.
4. Multi-cloud and cloud plus SaaS complexity
Organizations are increasingly managing not only public cloud infrastructure but also SaaS applications, private cloud, and licensing costs. This expansion introduces fragmented billing systems and inconsistent cost visibility across platforms.
These cost drivers are not caused by isolated misconfigurations but by architectural decisions, limited visibility, and unclear ownership. Addressing them requires continuous monitoring, clear accountability, regular review cycles – and leveraging some tools from the list we reveal below.
Tools that support cost optimization
Cloud providers offer native tools for cost management. These tools provide visibility into usage and spending patterns. Examples include AWS Cost Explorer, Azure Cost Management, and GCP cost tools.
Third-party platforms extend these capabilities. Tools such as CloudZero, Vantage, Ternary, ProsperOps, Spot.io, Kubecost, and Apptio provide advanced analytics, forecasting, and automation features.
Let’s compare some common tool categories.
The next step is to evaluate how deep each tool goes in core capabilities such as visibility, forecasting, and more. This helps teams understand not only what a tool does, but how effectively it supports ongoing cost optimization.
However diverse these lists may be, it’s important to remember that tools alone do not solve cost issues. Outcomes depend on how teams act on the insights provided. Processes and governance play a critical role in achieving sustained improvements.
Build your own FinOps workflow
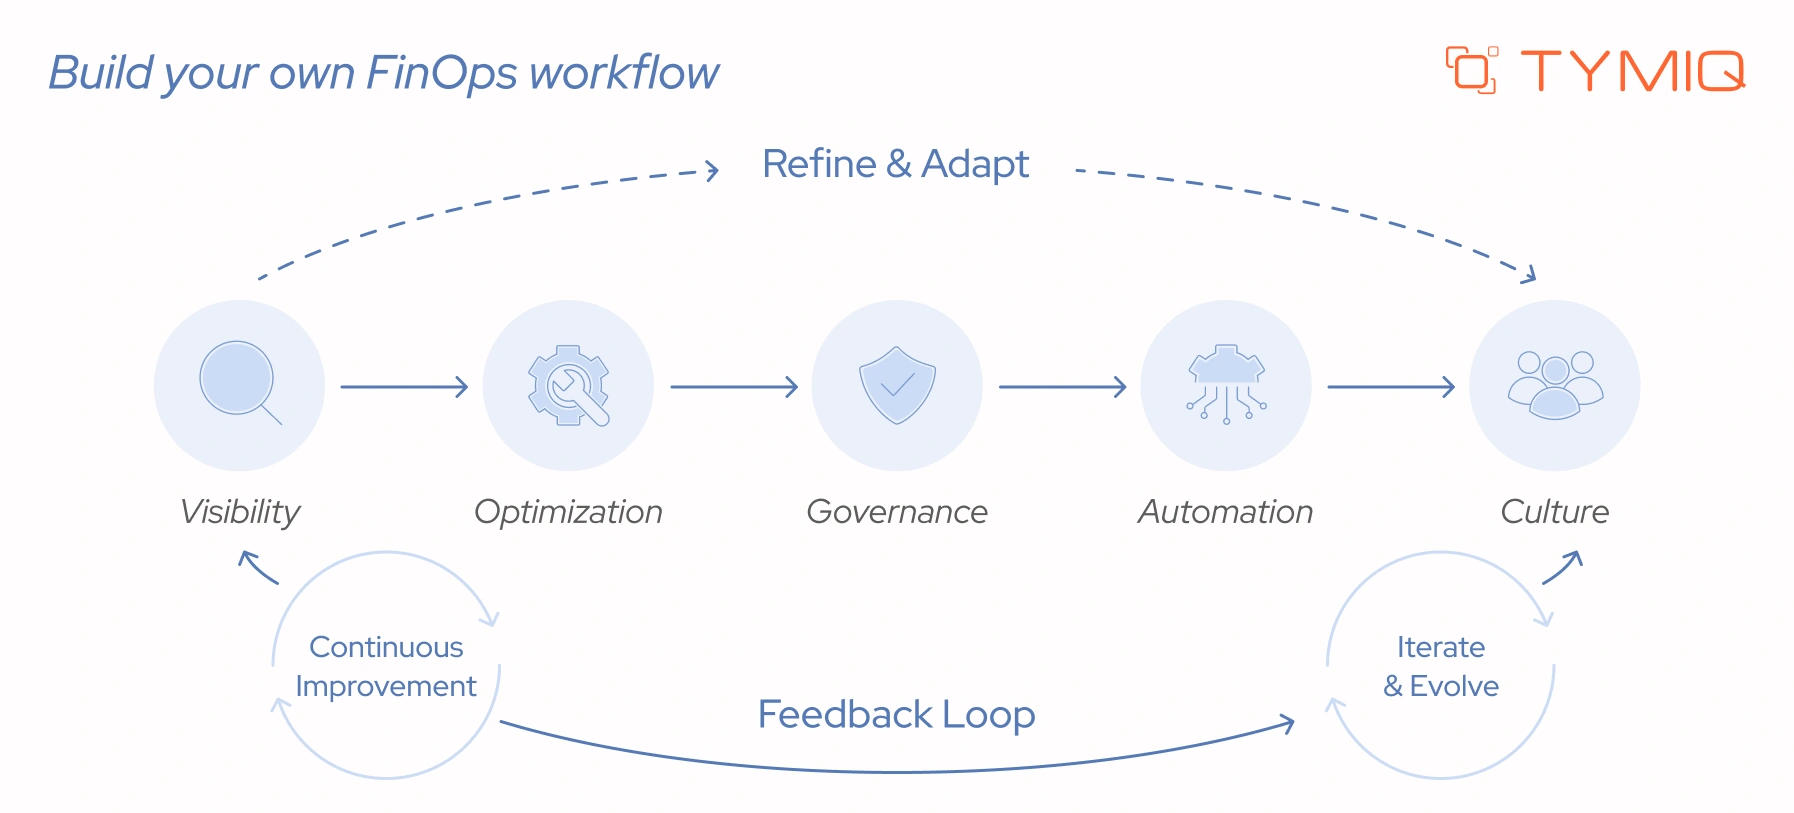
The TYMIQ team developed this approach after seeing the same cost patterns repeat across different cloud environments. Below, we have something to offer that brings all of these elements together in a practical way. It is not a cure-all, but it gives you a solid foundation to build on and adapt to your specific architecture and needs.
Apply the following approach to manage cloud costs with consistency and control:
Start by making costs visible and understandable. Teams need centralized dashboards and consistent tagging strategies to track spending across services and environments. When costs are clearly mapped to workloads and owners, decision-making becomes faster and more precise.
Once visibility is in place, focus on reducing waste. Rightsizing compute resources, scheduling non-production workloads, and applying storage lifecycle policies are the most effective starting points. These actions should not be one-time efforts. They need to run continuously as workloads evolve.
Next, introduce clear guardrails. Budgets, alerts, and ownership models help control spending before it becomes a problem. Each service should have a defined owner responsible for cost decisions. Without ownership, optimization efforts lose momentum and accountability breaks down.
After establishing control, begin automating repetitive tasks. Start with simple actions such as scheduled shutdowns and alerting. As confidence grows, expand toward automated rightsizing and anomaly response. Automation improves consistency and reduces manual effort over time.
Long-term success depends on shared responsibility. Cost awareness should extend beyond finance teams and become part of engineering workflows. When engineers see cost alongside performance and reliability metrics, they make more balanced decisions during development and operations.
From the TYMIQ data engineers' perspective, ownership remains a critical foundation. Every service should have a clearly defined cost owner who is responsible for monitoring and optimization. This creates accountability and drives action.
Another key practice is integrating cost metrics directly into engineering dashboards. When cost data sits next to system performance metrics, teams gain continuous visibility into the impact of their decisions.
We also recommend running weekly cost reviews. These sessions focus on identifying anomalies, reviewing major cost drivers, and assigning clear action items. Over time, this builds a consistent optimization rhythm that keeps costs under control.
Final thoughts: focus drives results
Cloud cost optimization becomes manageable once the problem is reduced to its core drivers, where the 80/20 rule provides a practical lens. Instead of spreading effort across dozens of optimizations, teams can target the few changes that consistently deliver the highest impact. This approach improves clarity, speeds up results, and creates a stronger foundation for long-term cost control.
The next step is applying these principles to your own environment. Every system has its own patterns, constraints, and opportunities. The key is knowing where to look first and how to act on what you find.
If you want a clearer view of your cost drivers or a second opinion on your current setup, the TYMIQ team can help. Reach out to discuss your architecture, identify inefficiencies, and define a focused optimization strategy that fits your environment.


.svg)


